Gigaton Scale Carbon Removal Through Agroforestry

Founder Fellowship

About: Working Trees is on a mission to achieve gigaton-scale carbon removal through agroforestry, paying farmers to plant and grow trees on their land.
Challenge: The existing mobile app lacked key functionalities, limiting farmers' ability to track tree measurements and revenue. Meanwhile, corporations needed better tools to monitor and verify carbon sequestration. The web dashboard was missing entirely, making emissions reporting inefficient.
Approach: Improved UI/UX simplified tree measurement, increased data transparency, and enhanced reporting accuracy for all stakeholders. Farmers gained a more intuitive way to track carbon revenue, while corporations and organizations accessed real-time monitoring and forecasting tools.


Design Process
This project focused on introducing new functionality and designing a fresh dashboard. Research in the agroforestry domain was crucial, leading to structured UX improvements. The design process included high-fidelity screens and a design system, with continuous collaboration with the client to ensure alignment with business goals.
Research & Exploration
Design & Prototyping
Branding & Web Design
Features
Mobile app: track trees
We refined the mobile experience, making it easier for farmers to track, measure, and update tree data. The interactive map highlights trees that need measurement, while AR-powered tools streamline height and diameter tracking, even for multi-trunk trees.
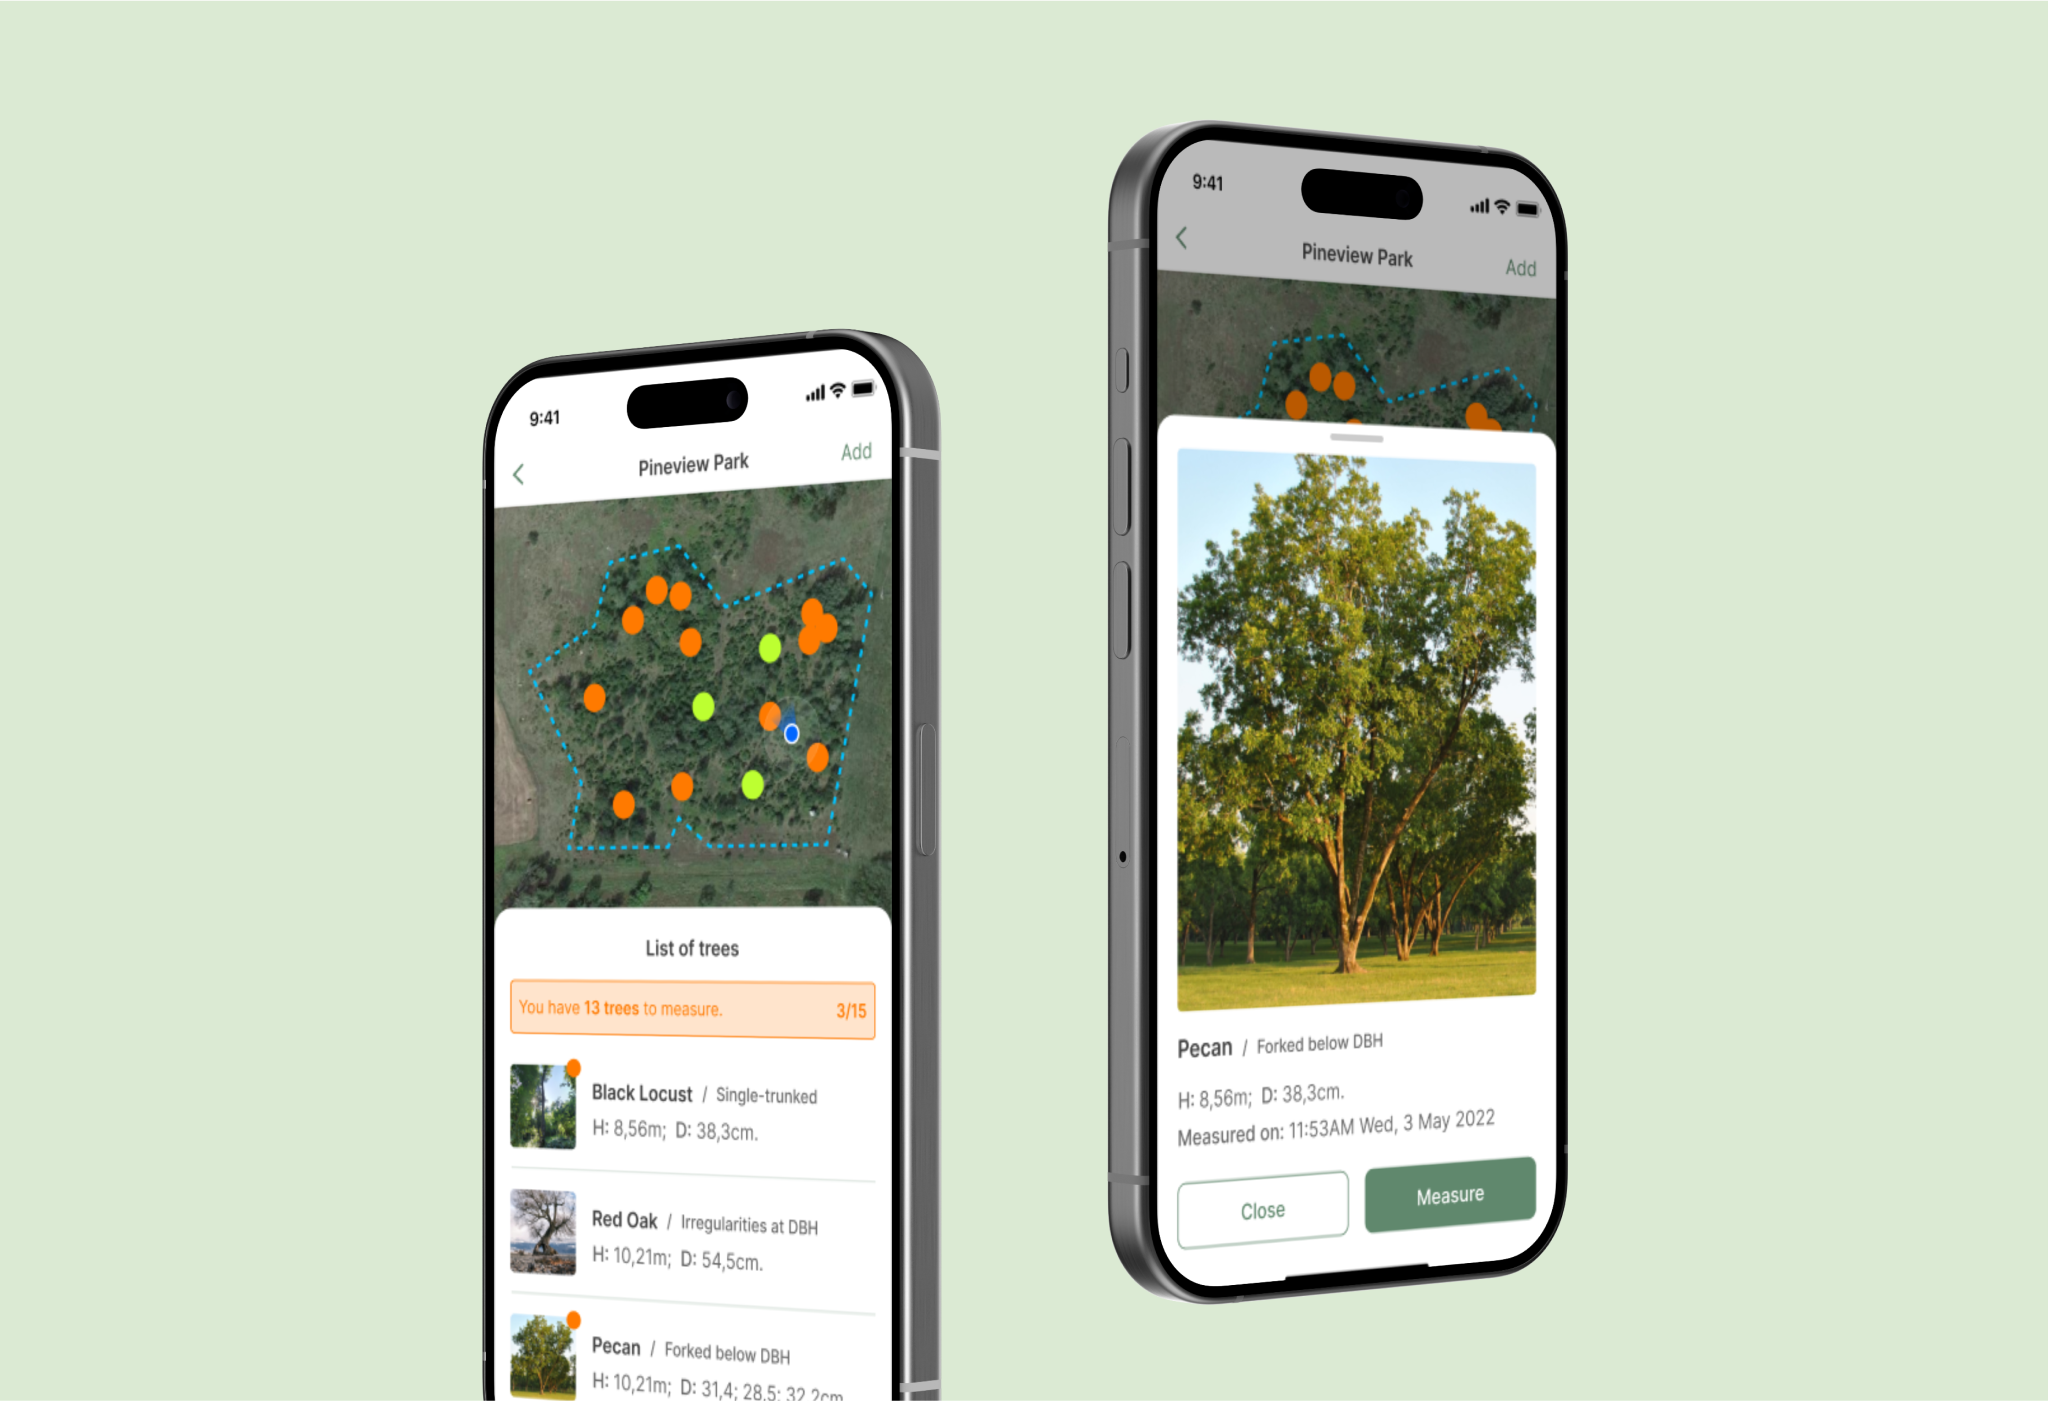
Mobile app: Measure Trees
Reservation Flow: Additionally, we implemented a Reservation Flow that simplifies the process of creating reservations. Users can search for a customer by name, email, phone, or account number, and easily input required package details such as Location, Package Size, Reservation Type, Delivery Agent, and Tracking Info. This feature also includes the ability to track reservations, with options to edit and extend them as needed.


Dashboard: Overview
The dashboard provides farmers with a clear view of their carbon earnings and land data. It displays total CO₂ stored, tree count, pasture area, and financial insights. Each tree is listed with species, measurement history, and location, ensuring accurate tracking.

Dashboard: Biometrics
This section visualizes CO₂ sequestration trends and land composition. Farmers can see projected carbon removal over time and analyze tree distribution by species. The terrain coverage chart highlights tree cover, shrublands, grasslands, and croplands.

Dashboard: Eligibility
A farm map categorizes land as eligible, neutral, or ineligible for planting trees. Past land use insights, presented through bar charts, show historical coverage of tree cover, shrublands, grasslands, and croplands to inform sustainable decisions.

Dashboard: Farm Details
This section provides an overview of the farm, including size, location, and sustainability focus. Farmers can upload photos, track certifications, and monitor tree protection measures. Layout considerations ensure optimal planting efficiency, while challenges like pests and weather are addressed through integrated management strategies.

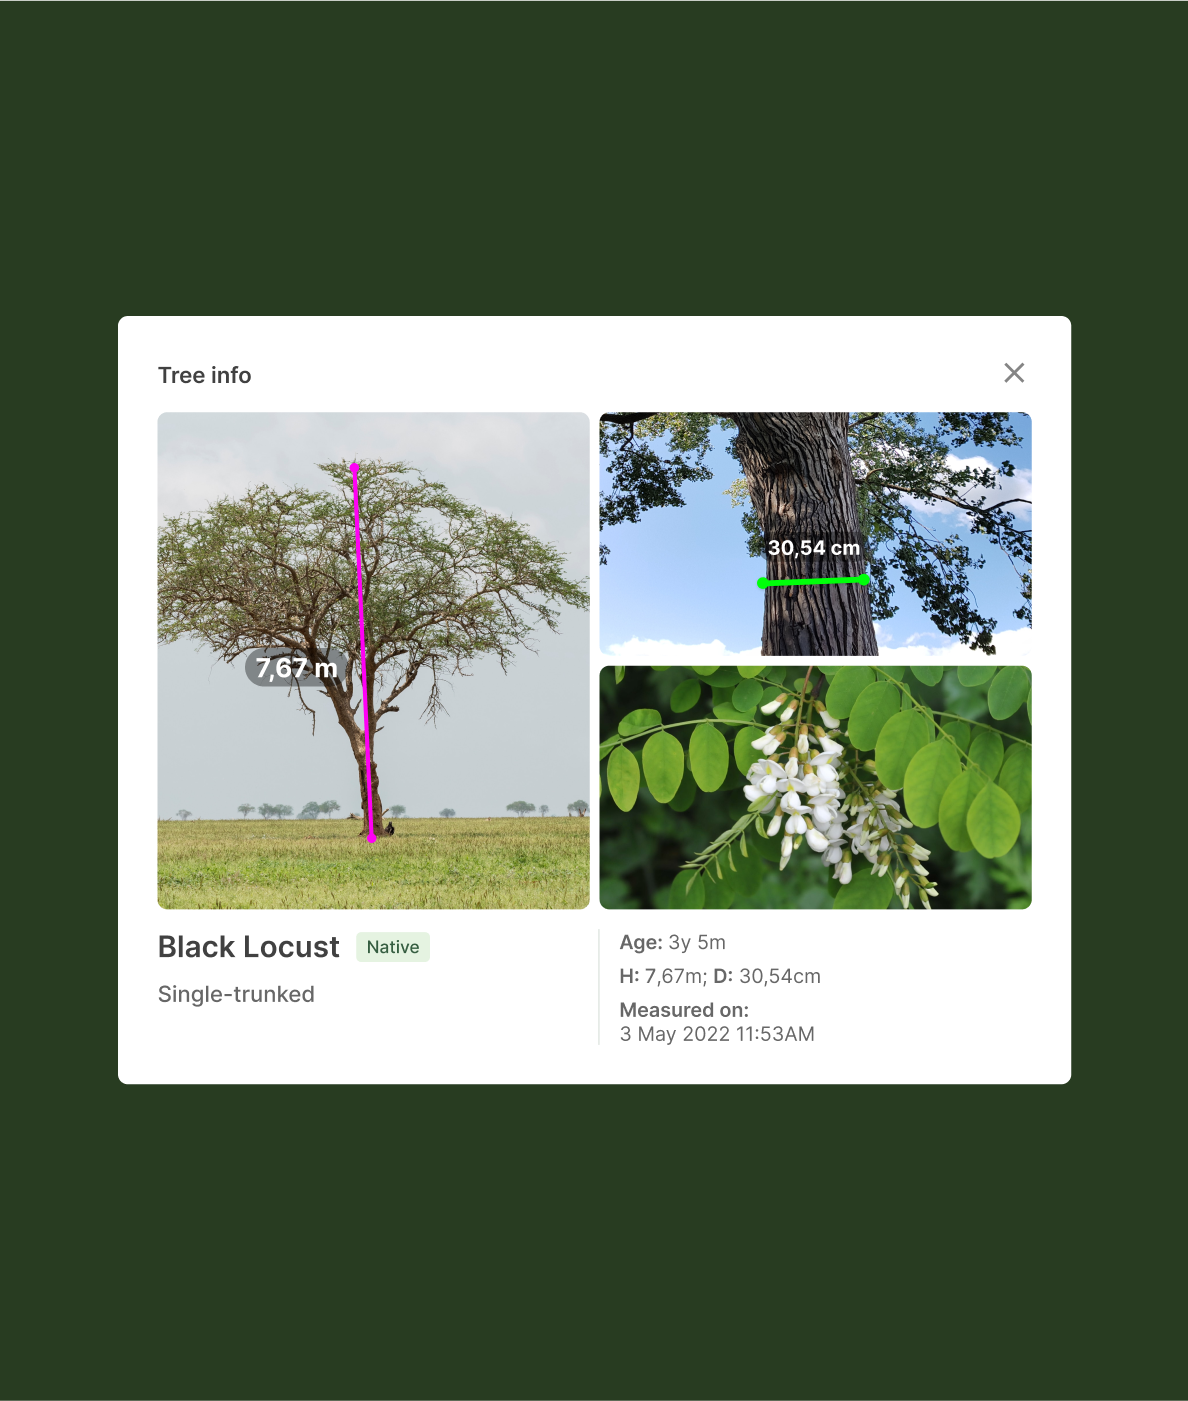
Tree Info
Hovering over a tree in dashboard shows a quick preview with a photo and key details. Clicking opens a full modal with measurements, markings for height and trunk width, and additional images. This helps stakeholders verify tree conditions and data accuracy easily.

Branding
Discovery Phase: We initiated the project with workshops and interviews to understand GoLocker's challenges, user needs, and business objectives. This phase set the foundation for our design approach.


Website
Discovery Phase: We initiated the project with workshops and interviews to understand GoLocker's challenges, user needs, and business objectives. This phase set the foundation for our design approach.


Have a project in mind?
MORE CASES
Designing a Generative AI Applications Software Platform


Redesign of the UAE's official parcel delivery service

